Practical 3-6: Compare the mean stochastic model to the deterministic SIR model
Overview
In this practical, we want to compare the mean stochastic result with the deterministic result for the SIR model. Don’t worry if you don’t have time to do this practical. It’s intended for people who are finding this course too easy!
Background
We know that the outbreak can die out by chance before it gets going in the stochastic model, and it’s not clear that the deterministic model takes this into account, so we want to directly compare the two and check. Also, since the stochastic model can finish before the end time of the simulation, we need a small amendment to allow us to average across “incomplete” simulations.
Tasks
Adapt the code from d0305_run_SIR to make a new demo, 0306_mean_SIR. Try just adding the
stochastic simulations from 3-5 together by adding the
final.populations data frames together, and then dividing
by the number of runs. Unless you are lucky (in which case run it
again!), you will probably find the adding up fails because the data
frames are different lengths. This is because some (all) simulations
finished early because the outbreak died out.
Go to the SBOHVM/RPiR package on
github and look at the cleanup_timesteps() function (which
actually calls cleanup_times() – both functions are in
R/cleanup.R). This function takes a
population data frame and tidies it up in various ways. For our
purposes, we can use it to extend a data frame to the correct end time,
by repeating the population sizes when the outbreak finished over and
over again until we have reached the correct end time. We just call it
as follows:
final.populations <- cleanup_timesteps(final.populations,
                                       timestep = this.timestep,
                                       end.time = end.time)
Once we have done this, we can calculate the averages by just adding
the populations from each stochastic run to each other and dividing by
the number of runs. Plot this averaged stochastic result against the
deterministic result as in Practical 2-5. To do this, you will
also have to copy the function for the deterministic SIR model into this
package and turn it into a function in the package. The
function will need documentation, but otherwise it work with
run_simulation() without changes, as (unlike
run_simple()) it can cope with model functions that return
just data frames, or functions that return a list like your new
stochastic functions.
You should get something like this:
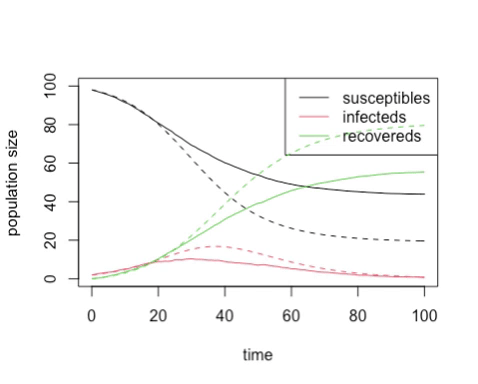
plot
particularly if you used these parameters:
initial.infecteds <- 2
initial.recovereds <- 0
sir.transmission.rate <- 0.2
sir.recovery.rate <- 0.1
Running the code
Try running the code with an \(R_0\) of 2, and a variety of different numbers of initially infected animals. You should find that as we start with more initially infected animals, the chance of the outbreak not taking off drops, and the stochastic model looks more and more like the deterministic model.
The Science
This is a real research result! Deterministic models are not capable of detecting this possibility of stochastic extinction, and this is one of the major advantages of stochastic models.
Report
Write a demo, showing stochastic extinction. Show different results for stochastic models and deterministic models for small initial outbreaks and low values of \(R_0\), but similar results for high \(R_0\) / high initial numbers of infecteds.
Check it works
As with previous exercises, you need to check that everything works correctly – that the package installs, and the demos and help files work and you can generate reports from the demos – and then we want you to get a couple of other people in your subgroup to check your code and make sure it works for them, and we want you to check other people’s code too. We describe how to do this for packages in GitHub in Practical 3-1 (also under Check it works) if you’re uncertain.
Remember, interacting like this through GitHub to help each other will count as most of your engagement marks for the course.